Posts

How to solve Bayesian Problems using a table

Image
 Example 1.  A cab was involved in a hit-and-run accident at night. Two cab companies, the Green and the Blue, operate in the city. You are given the following data: 85% of the cabs in the city are Green and 15% are Blue. A witness identified the cab as Blue. The court tested the reliability of the witness under the circumstances that existed on the night of the accident and concluded that the witness correctly identified each one of the two colors 80% of the time and failed 20% of the time. What is the probability that the cab involved in the accident was Blue rather than Green? Solution Example 2: Medical Diagnosis: A certain medical test for a disease is known to be 99% accurate. However, the disease is rare, occurring in only 1% of the population. If a person tests positive for the disease, what is the probability that they actually have the disease? Example 3: Coin Toss: You have two coins in a bag. One is a fair coin (heads and tails are equally likely), and the other is a biased

How to find the sample Size

Image
 

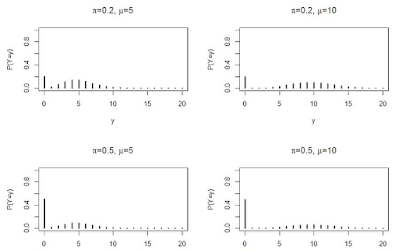
Zero Inflated Poisson Distribution: What it is

Image
The zero-inflated Poisson distributio n is a mixture of a point mass at zero and a Poisson distribution. It is suitable when there is a significant number of zero values in the dataset, and a few datapoints have large values. This distribution allows for the excess of zeros and captures the occurrence of larger values. Intuition Imagine you have a dataset that represents the number of events that happen within a certain time or space, like the number of cars passing by a particular street in an hour. Usually, many hours will have no cars passing by, and only a few hours will have some cars passing by. The Zero-Inflated Poisson Distribution is a way to describe this kind of dataset. It combines two ideas to better represent the data: Lots of Zeroes : First, it acknowledges that many hours have no cars passing by. These zero counts are more common than any other number of cars. So, it considers two possibilities: either there are no cars at all (zero count) or the usual Poisson distrib

How to Remember the concept of p-value

 p value is always in the context of hypothesis testing.  we reject the null hypothesis at significance level  α α  when p value is less than  α The mnemonic is:  If p is low, the null must go! source

How to Remember the Definition of Type I and Type II errors

 There are some clever mnemonics Type 1 error: Rejecting H0 when it is true Type II Error: Not rejecting H0 when it is false source1 Here are the mnemonics to remember: 1. Remember the story where the boy cried wolf  H0 : There is no wolf H1: There is a wolf data sample: Boy's cry Type I Error:  The first error the villagers made (when they believed him) was a type 1 error. Type II Error:  The second error the villagers made (when they didn't believe him) was a type 2 error 2. This has some truth in it. But can be ageism also Young scientists commit Type-I because they want to find effects and jump the gun while old scientist commit Type-II because they refuse to change their beliefs. 3.  A Type I error is a false POSITIVE; and P has a single vertical line. A Type II error is a false NEGATIVE; and N has two vertical lines. 4.  Type I errors are of primary concern Type II errors are of secondary concern 5. Remember RAAR, Reject when you should Accept ( type I) Accept when you s

Precision, Significance Level, Confidence Level, Confidence Interval, Power, Degree of Freedom, p-value,aql, z-value, t-statistics Explained

Precision : In hypothesis testing, precision means how sure we want to be before making a decision. For example, if we want to know if a new medicine is better than an old one, we need to decide how sure we want to be that the new medicine really is better. Do we want to be 90% sure, 95% sure, or 99% sure? The higher the level of precision we choose, the more sure we are before making a decision.  It refers to the level of accuracy or the margin of error that you are willing to accept in your estimate or measurement. For example, if you choose a precision level of 5%, it means that you want to be 95% confident that your estimate is within 5% of the true value. In traditional hypothesis testing using the normal distribution, precision is not explicitly used because the significance level is used instead. The significance level determines the probability of rejecting the null hypothesis when it is actually true. It is often set to 0.05, which means that we are willing to accept a 5% pro